 or the
Debug SPARQLMotion script button
or the
Debug SPARQLMotion script button  . The difference between these two
buttons is that Debug will always display the SPARQLMotion Debugger (described further below) before executing the script's first module.
. The difference between these two
buttons is that Debug will always display the SPARQLMotion Debugger (described further below) before executing the script's first module.
There are several ways to execute a SPARQLMotion script in TopBraid Composer:
or the
Debug SPARQLMotion script button . The difference between these two
buttons is that Debug will always display the SPARQLMotion Debugger (described further below) before executing the script's first module.
At the end of script execution, depending on the type of target modules, the system may open a SPARQLMotion Results window to display the output triples, or it may display a map, or other view depending on the nature of the output. Some modules also require user interactions and may open up a selection or input dialog.
SPARQLMotion scripts can also be executed using a TopBraid Live server either programmatically or as web services. See Overview of TopBraid Live Integration and Overview of Web Services for further information.
During script development it is sometimes convenient to temporarily disable certain modules, so that they are ignored and all input values simply passed through. This can be achieved by selecting the module(s) to disable and clicking the corresponding button in the tool bar of the SPARQLMotion graph. Disabled modules appear with a black cross above their icon.
SPARQLMotion scripts are not always trivial to develop, and various iterations may be needed to create a correct script. Just executing a script may not give enough insight into the cause of a problem. It can be easier to see intermediate results of partially executed scripts and variable bindings at different points in the script as it executes.
TopBraid Composer includes a SPARQLMotion Debugger that you can use to:
There are two ways to open the SPARQLMotion Debugger:
. This runs the script and displays the debugger for the first module.There are two ways to set a breakpoint:
 . A blue circle resembling the button will appear on the upper-left of the module's icon to indicate that it has been selected as a breakpoint.
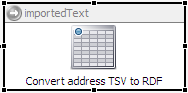
The Debugger window has several panels and tabs to show different information about the script being executed and the module where execution was paused.
This panel on the left displays the currently executing module in a tree structure. The engine processes the modules from top to bottom. If a module branches off of a nested subscript (for example, a conditional branch statement or loop), then the modules of the subscript are displayed as children of the parent node. The selection of tree nodes has no effect on the script's execution.
The check box before each module can be used to set or remove breakpoints.
This tab in the upper-right displays the current input variable bindings that have been passed to this module. For example, if a SPARQLMotion Bind By Select module preceding the displayed module had set the variable ?color to the value "blue", this name and value would appear as a row in this list.
This list in the lower-right displays the values that the SPARQLMotion engine will use for the declared arguments of the current module. These are typically values that were entered when the module was originally created and configured; if variable names were used for any of the arguments, this will show the value of the variables during the current execution.
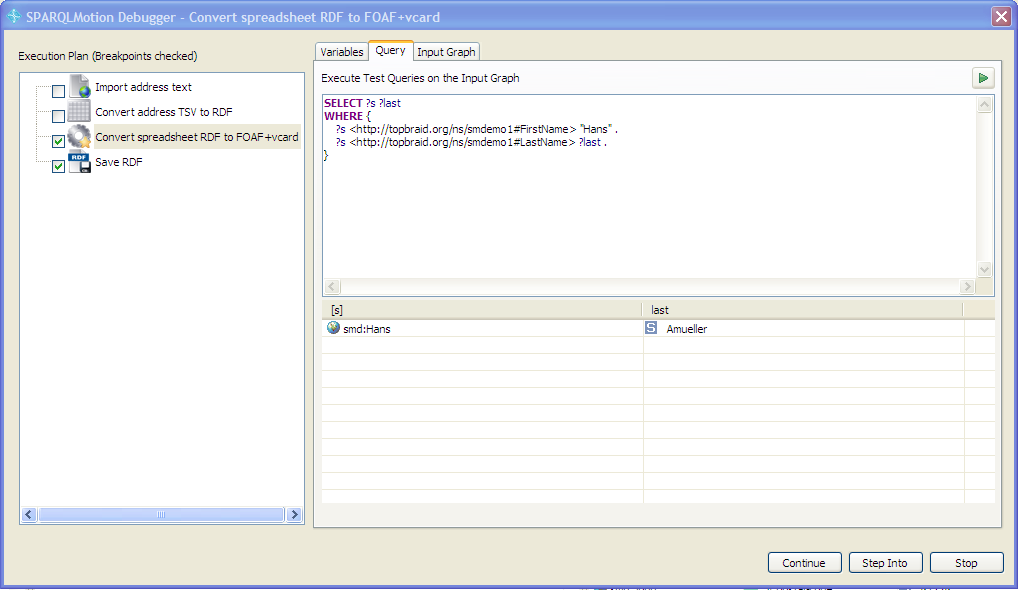
The Query tab in the upper-right gives you a place to enter SPARQL SELECT queries on the input graph
of the current module. If the current module has a query as one of its arguments, then a SELECT query with the WHERE clause of that query will be inserted into the query editor field. After you enter or edit a query and click the tab's Run query button in the upper-right, the debugger will display the results under the query.
The query will use the current variable bindings, letting you simulate how the system will behave in this context and explore variations on that behavior. For example, if a query entered when configuring the module is not returning anything, edits and simplifications of that query in this panel can help you isolate the problematic part of the query.
Variable bindings made in queries on this tab will not affect the behavior of subsequent modules in the script.
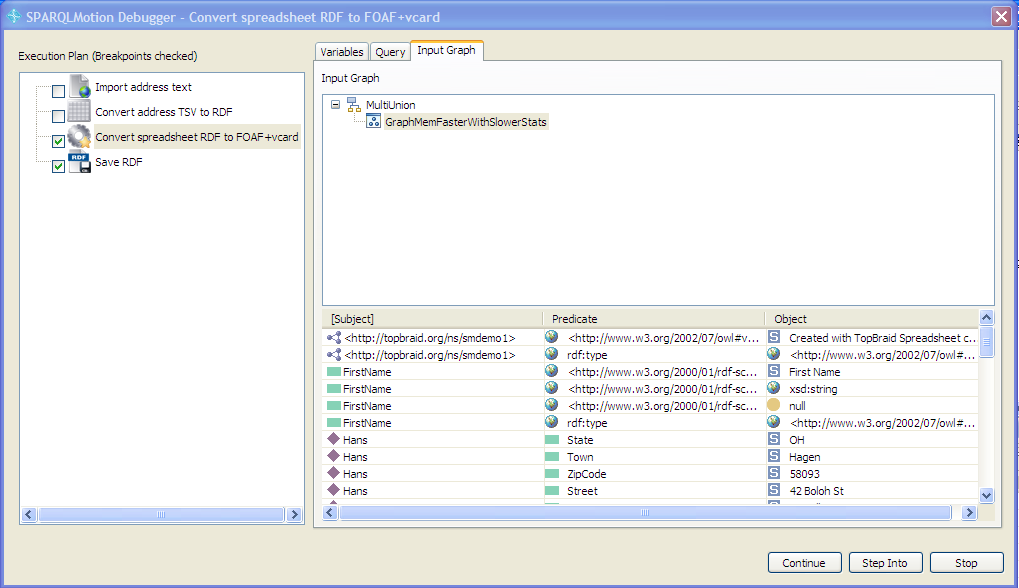
Use this tab to browse the structure of the input graph and the triples contained in each of its sub-graphs. The input graph may be a composite of multiple child graphs (a "MultiUnion" graph). For each graph, the type and, if applicable, the base URI is displayed. Clicking on a graph will display its children at the bottom.
The main feature of the Debugger is allow users to halt the execution of a script to introspect into intermediate states. After this happens, click one of the buttons at the bottom in the dialog box's lower-right to indicate the next action to take:
sm:next modules,
you can create files with intermediate results. For example, if you
want to analyze the RDF output of a certain module, you could connect
it with a temporary sml:ExportToRDFFile module as part of your debugging session. This module would
write the triples into an RDF file that can you can then open with TopBraid
Composer. A frequently used debugging module is
sml:CreateSpreadsheet, which outputs the results of a SPARQL
query to the screen or into a file if you follow it with an sml:ExportToTextFile module.After you have executed a SPARQLMotion script using the debug button in the graph, you will see a message box such as the following:
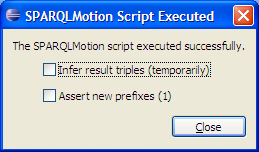
This provides up to three options that can be very helpful for developing and debugging scripts:
 when done to return your model
to a clean initial state.
when done to return your model
to a clean initial state.Putting these options into context, a typical workflow for developing SPARQLMotion scripts is:
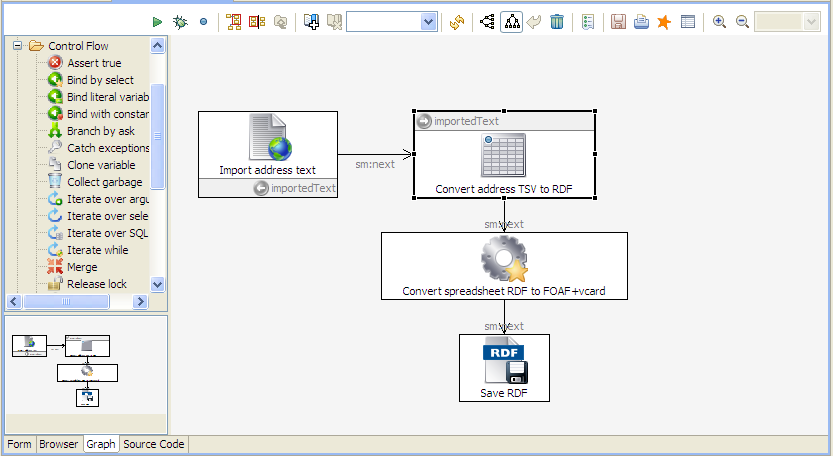
In the following script, the first module imports a remote tab-separated value spreadsheet of addresses, stores its content in a variable called ?importedText, and passes that to the second module, which converts the text to a simple RDF representation based on the spreadsheet's structure. The third module converts those triples to use the FOAF and vcard vocabularies, and the fourth module stores the result in a disk file. Note how the second module has a small blue circle indicating that it is a breakpoint; if this module was selected and you then clicked the blue circle on the toolbar next to the bug icon, this would toggle the second module's status as a breakpoint off, removing the blue circle.
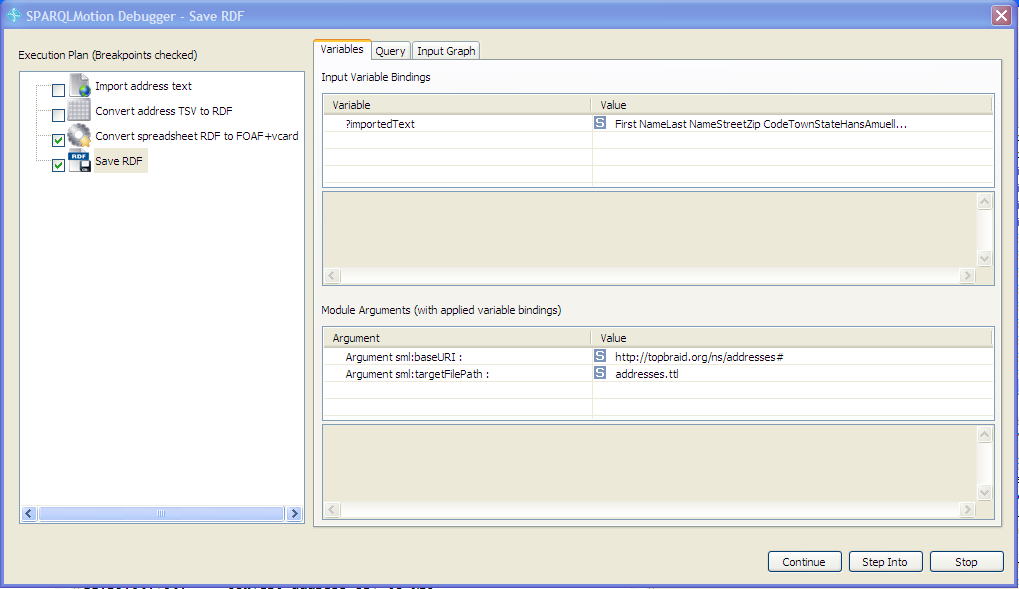
If, with the last module selected, we instead click the Run SPARQLMotion script button to indicate that we want to run the script up to the selected module, the script runs up to that first break point and displays information about the script execution's current state.
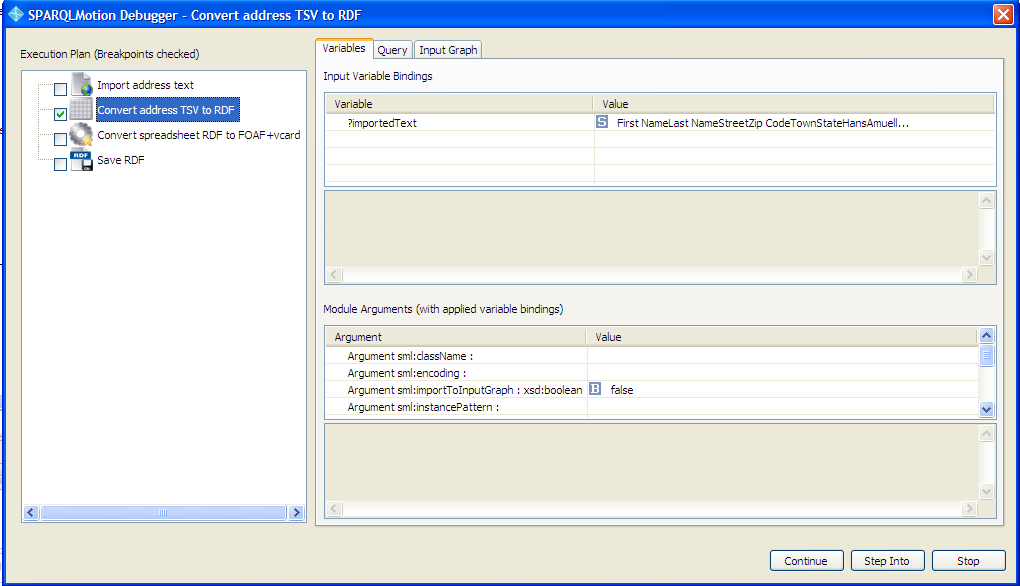
We see on the Input Variable Bindings list that the ?importedText variable has been populated with a string beginning with "First NameLast NameStreet...", so we know that the text was successfully retrieved from the remote location. (Checking whether variables were populated as expected is one of the most useful things about the SPARQLMotion debugger.) Below that, the Module Arguments panel shows the values used to configure the "Convert address TSV to RDF" module when it was created. As noted above, if a variable was used for any of the arguments, at this point the debugger would show the value that had been stored in that variable—another excellent place to check when a script doesn't behave as you had expected.
Because the "Convert address TSV to RDF" module is the only one checked in the execution plan on the left, clicking the Continue button in the lower-right will resume execution to the end of the script. Before doing so, you can check any number of subsequent modules in the execution plan if you want to stop at those points as well, or instead of clicking Continue you can click the Step Into button to advance the debugger to the next module even if that module is not set as a break point.