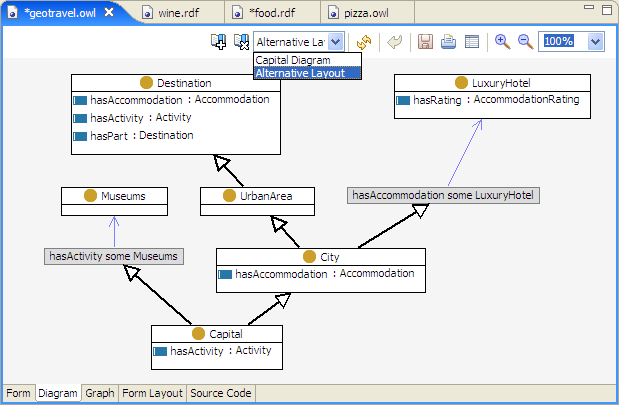
The Diagram Panel can be used to visualize and edit ontologies in UML-like diagrams. It is accessed by clicking on the Diagram tab at the bottom of the Resource Editor.
Each class is shown as a rectangle. Inside the rectangle
you will see all the properties the class is in the domain of - either
based on rdfs:domain statements, or on local
OWL restrictions or SPIN constraints such as spl:Attributes.
Classes shown in the diagram can be moved around and rearranged.
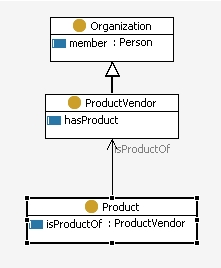
Thick black arrows depict subclass relationships. In the diagram
below ProductVendor is a subclass of Organization.
Thinner black arrows show property relationships that have been defined using
rdfs:domain and rdfs:range
statements. ProductVendor is in the range of the
isProductOf property. Product
is in the domain of the property.
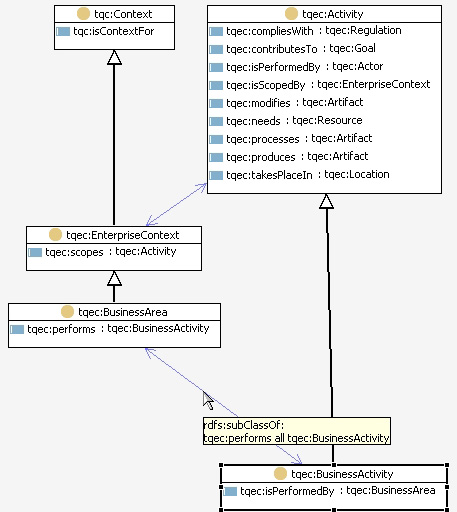
When a subclass relationship has been inferred, it is shown as a thick blue arrow.
Mouse over the class rectangle to see arrows at both ends - incoming and outgoing. Yellow arrows indicate that there are connections to or from the class. Click on the arrow to expand the diagram, revealing the neighbors of the current class.
Thin blue arrows show relationships defined using
rdfs:subClassOf local restrictions. Mouse over the arrow to
see the restriction axiom.
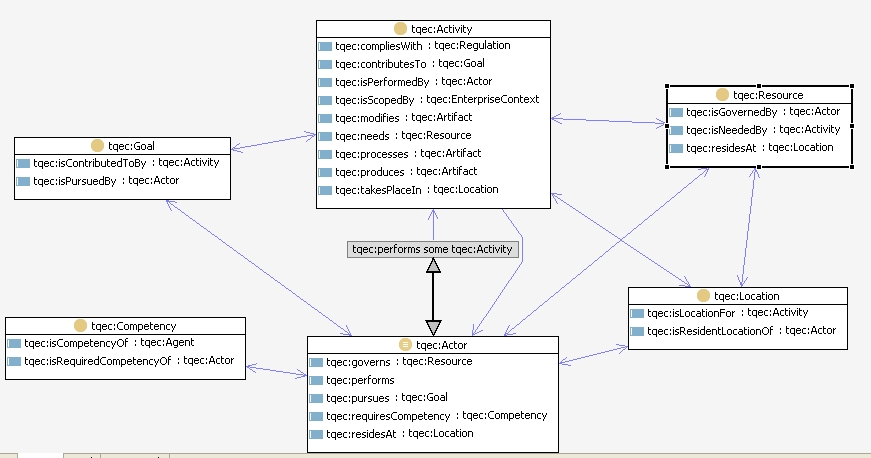
Local restrictions defined using owl:equivalentClass are
shown as small gray-shaded rectangles. In the diagram below Actor has been defined as
equivalent class of tqec:performs some tqec:Activity.
Red arrows show disjoint classes.
Note that you can drag and drop classes from elsewhere (e.g. from the Classes View) into the class diagram to add them to the display. The system will in this case add edges to all classes that are already in the diagram.
When you open a diagram for the first time, it will contain the
currently selected class with all its superclasses, plus the direct neighbors of
the selected class. By default, each time you open a diagram or change the
selected resource, the diagram will be reset to this layout. If you have
expanded a diagram to a state that you want to keep for your records, you can
use the snapshot feature, as shown below. All snapshots in your project will be
saved together with your ontology, into a file ending with .diagrams.
The icons at the top of the panel provide the following options:
The palette on the left of the diagram shows various tools that can be used to switch between edit modes:
rdfs:domain of the new
property. Then click on the class that shall become the rdfs:range
of the new property. The resulting dialog allows you to enter a name for the new property.
If you have activated the corresponding preference,
the system will create an owl:allValuesFrom restriction instead of range
and domain statements.
In order to delete a subClassOf or association, right click on the connection and select Delete in the popup menu. Note that deleting an association will also delete all triples that use this property.
A double-click on a class opens a form to edit the details of the class. A double-click on an "attribute" property opens a form to edit the details of that property. Right-click on an "attribute" property and select Delete to completely delete it.
If you right-click on an attribute property or an association connection, the resulting
popup menu will include items to set the cardinality (using owl:Restrictions) to either
0..1, 1..1, 0..n or 1..n.
If you move the mouse over a class box, a small button will appear in the lower right
corner. This button can be used to create a new (datatype) property that will have the
class as its rdfs:domain. In the resulting dialog, you can enter a name for
the property and also specify a rdfs:range such as xsd:boolean,
xsd:float, xsd:integer or xsd:string.
Note that the system will by default not remember the layout of your diagram. For example if you have added a new class to a diagram and then move to another class (wiping out the current diagram) and then come back to the class where you started editing with, then the diagram will only contain the default diagram for that class. Use the snapshots feature described above to keep diagrams exactly like you have edited them.