The Graph Panel can be used to visualize and edit connections between resources, and to generate SPARQL queries visually. The Graph Panel is accessed by clicking on the Graph tab at the bottom of the Resource Editor.
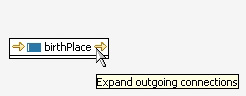
When you first enter the Graph Panel, the currently selected resource will be shown in the center as a rectangle. Mouse over the rectangle to see arrows at both ends - incoming and outgoing. Yellow arrow indicates that there are connections to or from the resource. These are predicates in the RDF triples.
Incoming arrows will show triples for which this resource is an object. Outgoing arrows will show triples for which this resource is a subject.
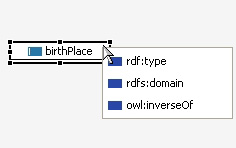
You can click on the arrow to expand the graph. A context menu will open up, allowing you to open either all relationships or only a selected relationship.
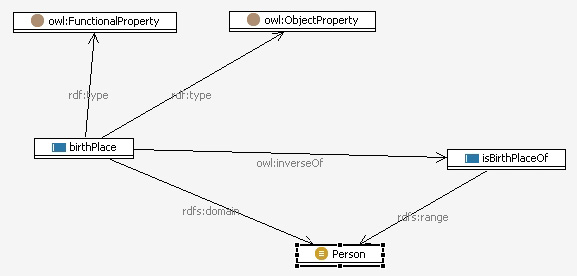
The screenshot below shows the graph after two expansions
You can move the nodes of the graph around the panel to rearrange them. Comparable to the Diagram view, you can take snapshots of the graph and restore them later. You can also drag and drop resources from anywhere else on the screen (e.g. from the Instances View or the Classes View) into the graph. The system will in this case add connections to all nodes that are already in the graph.
Note that the graph uses the "Maximum number of values of forms" as maximum of edges shown for an individual relationship. This makes sure that users don't accidentally open huge graphs. Change this on the main Preferences page of TopBraid Composer.
The icons at the top of the panel provide the following options:
If a resource on the graph has a value for the property foaf:depiction, or a sub-property of this, then the graph node will contain the image, as shown below.
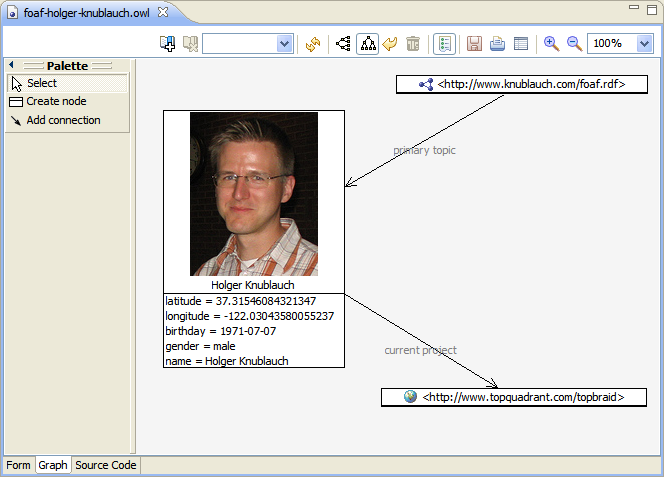
You can insert arbitrary images if they are linked as object property values: just make your image property a sub-property of foaf:depiction. You may want to include the foaf namespace from the standard ontology library for that.
The Graph can also be used for basic ontology and instance editing. You need to locate and expand the tool palette to be able to switch between Selection, Creation and Adding edge modes. Your screen may look like the one above. Select is the default mode, and can be used to move and expand nodes on the screen.
In order to create a new resource and its node, switch to Create node mode. Then you can click on any area of the screen and the system will present a create instance dialog. Alternatively, you can drag any class from other views such as the Classes View onto an empty area on the graph to create an instance of that class. Note that this only works in Create node mode - otherwise the class itself will be inserted into the graph. After a new node has been added, the editor will switch to Add connection mode.
In the Add connection mode, you can add edges between two nodes. Press and hold down the mouse over a node and then drag over the target node. Finally, release the mouse to establish a connection. The system will check for suitable (object) properties that could be used between those nodes, based on range restrictions in the ontology. If multiple possibilities are found, the system will present you with selection dialog.
To edit (or view) details of a given node, double-click on the node to open an external dialog. Alternatively, you can open a second Editor window (right-click on the Editor's tab that displays the file name above the editor and select New Editor, then move both editors side by side in your Eclipse view). Then, double-clicking on a node will show the form of the node in the other window.